
TOKEN VALUATION METRICS
Token valuation metrics for your crypto investment due diligence.

I curated a list of highly acclaimed token valuation metrics and made it into a guidebook for your crypto investment due diligence. There is no prerequisite for using these techniques except for a basic understanding of cryptocurrency. This guide introduces easy-to-understand crypto valuation metrics and how there are applied in token valuation.
This is the first of a two-part series that lays the groundwork for all future content on my channels. The pieces aim to proffer you the framework for developing a personalized investment thesis and follow-ups.
So without wasting any time, let’s get cracking.
IMPORTANCE OF VALUATION MODELS
The crypto market is inefficient and irrational. It is reefed with mispricings due to the speculative nature of the market. For example, it is not uncommon to find assets trading below treasury value; or experiencing a 50% price drop while experiencing an increase in revenue. You’re tasked with finding these alphas in the dips as an investor. And doing so requires a firm understanding of the valuation models for analyzing the market.
WHAT IS TOKEN VALUATION
Token valuation is the process of determining a digital asset’s current value. This is a tricky task due to the novelty and narrative-driven nature of the crypto market. Degens buying overpriced jpegs, influencers orchestrating pump and dump schemes, the rich stacking digital real estate, and other value inflating strategies have made it difficult for investors to build a decent watchlist. Regardless of the noise, every asset eventually converges to its fundamental valuations. As an investor, you want to calculate these fundamental valuations before the convergence. Token valuation metrics are categorized into relative and Intrinsic valuations.
RELATIVE VALUATION: Valuation Logic
Relative valuation is the process of extrapolating the value of an asset using a comparison to similar investments. Metrics such as market capitalization, total value locked, volume, revenue, and earnings give a good idea of a protocol’s performance over time. However, in isolation, these metrics proffer arbitrary values with no inherent justification for their valuations. Ratios are a fine way to provide this justification.
Valuation ratios estimate an asset’s value in the context of the market. That is to evaluate the worth of an asset based on the worth of comparable assets. The ratio of the analyzed assets is compared to determine the indifference point, which is the point where the opportunity cost of holding a particular asset is negligible. A rule of thumb is to use the industry or sample set mean as the point of indifference. Lastly, you extrapolate the subject asset’s market cap from the indifference point.
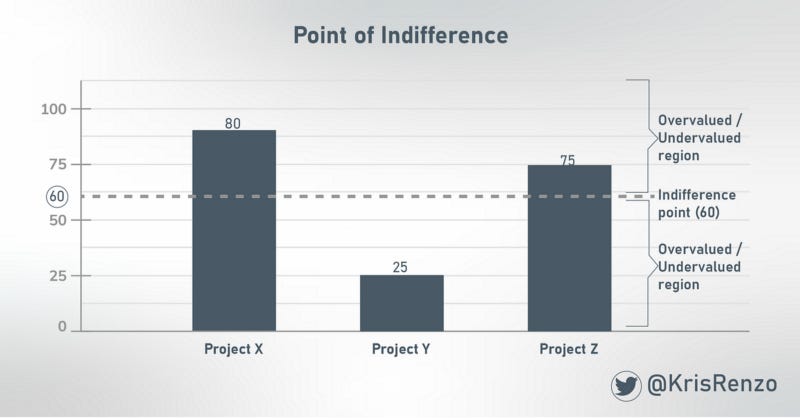
Fig 1. Point of indifference
RELATIVE VALUATION METRICS
1. Total Value Locked-to-Market Cap Ratio (TVL/MC)
Applicable Projects: DeFi protocols
TVL/MC essentially measures the core users’ faith in a project versus the general market appraisal of said project. It is a good measure of how early one is to an investment opportunity.
Calculation: TVL / MC
Total value Lock (TVL) is the total amount of users’ funds held in a decentralized finance (DeFi) protocol. These funds are typically deposited for functions like staking, liquidity pools, lending, etc. The size of a protocol’s TVL reflects users’ conviction of the project’s efficacy.
Market capitalization (MC) is the market value of a project. Market cap is the product of a token’s price and circulating supply.
Data Sources:
TVL: Defillama
Market capitalization: Coingecko, Coinmarketcap, Messari
2. Trading Volume-to-Market Cap ratio (TV/MC)
Applicable Projects: Exchanges like DEXes, NFT marketplaces, etc.
Trading volume refers to the total transaction amount facilitated by a platform over a time period. The trading volume-to-Market Cap ratio measures the worth of a protocol based on the value provisioned or the trading activity it is facilitating. The higher the ratio, the better the investment opportunity.
Calculation : Average (insert period) volume / Market Cap
Insert period: It could be daily, weekly, monthly, or yearly. It depends on the scale of your research.
Data Sources:
TVL: Defillama
Trading volume: Coingecko, Coinmarketcap, Messari, Dune Analytics
3. Trading Volume-to-Total Value Locked
Applicable Projects: DEXes
Trading volume-to-total value locked ratio measures the efficiency of a protocol’s resource utilization. The higher the ratio, the higher the liquidity providers’ reward, which leads to a higher incentive for more liquidity providers to join. This creates a positive flywheel effect and contributes to overall network growth.
Calculation: Average Monthly volume / Total value locked
Data Sources:
TVL: Defillama
Trading volume: Coingecko, Coinmarketcap, Messari, Dune Analytics
4. Protocol Revenue-to-Total Value Locked Ratio
Applicable Projects: DeFi protocols
Protocol revenue-to-total Value Locked ratio measures the capital efficiency of a protocol. That is how much proceeds a protocol is able to generate with given resources. The larger the ratio is, the more effective the protocol is at generating fees from its locked capital.
Protocol revenue is the total fees paid to a protocol for its services. Example of revenue includes swapping fees on AMMs and interest paid by borrowers on interest rate protocols. Revenue is typically shared between liquidity providers and the protocol.
There are typically three types of revenue, namely, protocol revenue (what the protocol receives), supply-side revenue (what the lenders or LPs receive), and total revenue (protocol revenue + supply-side revenue). The revenue/TVL metric is best calculated with the total revenue because it accurately captures the protocol’s effectiveness in fee generation from locked capital.
Calculation: Revenue / TVL
Revenue = GMV * Take Rate
GMV: Gross merchandise volume is the demand for a project’s service. This refers to the total transaction volume facilitated by the protocol
Take rate: percentage of the protocol charges per transaction
Data Sources:
Revenue: Token terminal
Take rate: Protocol’s white paper
GMV: Analytic platforms like Dune analytics
5. Price-to-Earnings Ratio (P/E)
Applicable Projects: All fee-generating protocols.
In the Equity market, the price/earnings ratio measures how much investors pay per share for $1 of earnings, i.e., dividend. However, due to the recency of the crypto market, not every protocol can distribute dividends to its token holders. Hence the modification of the metric to fit the crypto context. The lower the ratio, the better the investment opportunity.
Calculation: P/E ratio: fully diluted market cap / annualized protocol revenue.
Fully diluted market cap (FDV): the total value of the crypto at today’s price if all tokens are in circulation.
Data Sources:
Earnings: Token Terminal
6. Total Borrow-to-Total Value Locked ratio (TB/TVL)
Applicable Projects: Lending protocols
The total amount borrowed measures the demand for a lending protocol’s service. The higher the demand from borrowers, the better rates are for depositors (liquidity providers), which improves depositors’ desire to inject more liquidity, consequently increasing the protocol’s capacity for borrowing demand.
The total borrow-to-total value locked ratio measures the capital efficiency of a lending protocol. This translates to Protocol X being given $Y, and $Z is its amount being lent out.
Calculation: Average (insert period) Borrowed Amount / total value locked
Insert period: It could be daily, weekly, monthly, or yearly. It depends on the scale of your research.
Data Sources:
TVL: Defillama
Borrowed amount: Protocols analytics dashboard, Dune Analytics
7. Total Outstanding Debt/Derivatives-to-Market Cap
Applicable Projects: Synthetic Protocols
Total Outstanding Debt/Derivatives assess how much a synthetic protocol is used for its intended purpose. One of the main factors influencing revenue and protocol earnings for derivative protocols like Synthetix and Maker is synthetic assets or outstanding debt. The protocol can monetize more capital and distribute more cash flows to token holders if there is more outstanding debt. Debt outstanding reflects the demand for the synthetic protocol asset, e.g., DAI and SYNTHS for Maker and Synthetix, respectively. The ratio measures these demands to the protocol market value. The higher the ratio, the better the investment opportunity.
Calculation: Total outstanding debt / Market Cap
Data Sources:
Total outstanding debt: Protocols analytics dashboard, Dune Analytics
8. Metcalfe Ratios
Applicable Projects: All Protocols
Network value-to-Metcalfe (NVM) ratio
Total transaction value-to-Metcalfe ratio
Average transaction value-to-Metcalfe ratio
Metcalfe’s law states that the value of a telecommunications network is proportional to the square of the number of connected users of the system (n2). That is, it is a measure of “network effect.” Metcalfe ratios estimate a protocol’s value based on user participation in the network. Metcalfe value is the square of the number of active addresses.
The greater the ratio, the higher the price an asset currently trades to the number of active users. An asset may be overpriced relative to its active users if the Metcalfe ratio is high or indicate that high-expected user growth has already been factored into the asset’s price.
Calculation:
Network Value / Metcalfe = Network Value-to-Metcalfe Ratio
Transaction volume / Metcalfe = Total transaction value-to-metcalfe ratio
Average(Transaction value) / Metcalfe = Average transaction value-to-metcalfe ratio
Network value (NV): Market cap
Metcalfe = n²
n: active addresses
Note: For protocols that gain little to nothing from network growth, Metcalfe’s Law is ineffective.
Data Sources:
Active addresses: Protocols analytics dashboard, Dune Analytics
INTRINSIC VALUATION
The process of determining an asset’s value based on some underlying and objective value it possesses is known as intrinsic valuation. In an intrinsic valuation, the asset’s value is derived in and of itself. USDC has intrinsic value because of the US dollars that back it. Intrinsic value is essential because it can assist investors determine whether the cost of an asset is undervalued or overvalued compared to the asset’s market value.
INTRINSIC VALUATION METRICS
1. Network Value to Transactions Ratio (NVT Ratio)
Applicable Projects: Blockchains and Distributed Ledger Technologies
This metric is typically used for Bitcoin, as its single-purpose design guarantees the network transaction reflects its utilization. However, the metric can be applied to other networks that pay transaction fees in the native token.
NVT (Network Value to Transaction) is an indicator that describes the relationship between on-chain transaction volume and market capitalization of a blockchain network. The indicator moves within a range that is unique to every network. This range is established over time.
Calculation:
NVT = NV/T
NV: Network value (Market Cap)
T: on-chain volume measured in USD
Significance:
A high NVT ratio indicates a high speculative value or bubble territory. If the indicator rises to the upper band, it signals the on-chain activities are not justifying the current market valuation, i.e., overvaluation. And a correction is to be expected.
Note: Ensure the value transmitted on-chain represents the network utilization before applying the NVT ratio.
Shortcomings:
NVT can not be accurately applied to new networks in their growth phase as they require some time to establish a meaningful long-term range.
Secondary blockchains like Layer 2s and Sidechains reduce transaction activities on their primary network, which reduces the transactional value on the primary network, consequently distorting the NVT ratio. For example, a more accurate transaction value on the Ethereum network is an aggregate of the transaction values on the network and its layer 2s and side chains.
On-chain transactions such as the automated transfer of LP rewards from smart contracts to LPs don’t reflect a network’s utility. Such transactions skew the NVT ratio and must be factored out for a more accurate calculation.
NVT ratio does not apply to privacy cryptocurrencies as some or all of the value transacted on-chain is obfuscated.
Data Sources:
NVT: Woobull.com; Glassnode
2. Total Addressable Market
Applicable Projects: All protocols.
Also referred to as total available market, it is the overall revenue opportunity available to a product or service if 100% market share was achieved.
Calculation:
Top Down
A process of elimination is used in the top-down analysis to arrive at a specific market segment. It begins by using a large population of known size, which makes up the target market. The population estimates are obtained through reports and industry studies.
Bottom Up
Because the TAM estimations are determined by primary market research, bottom-up analysis is a more accurate method. It uses more reliable data about a product’s consumption and price at the time. For instance, an accounting app startup with an annual subscription costing $100 may need to estimate the number of businesses (potential customers) in its target area to determine its TAM.
Value-Theory
The value-theory approach focuses on the amount of value consumers get out of a product and how much they’re willing to pay for it in the future. TAM is calculated using value theory when a business is launching new items or cross-selling particular products to current customers.
For example, let’s say you’ve invented the new ASIC machine that mines cryptocurrency with 50% less energy consumption. If regular ASIC machines are sold for $1000 each, how much more would miners pay for lower energy-consuming ASIC machines? You estimate your TAM from the price you think miners will be comfortable paying.
Significance: TAM is necessary for determining the upside and downside potential. A project’s value is a product of the TAM and its market share.
Note: Crypto products TAM may or may not be limited to the crypto market. Projects with applications beyond the crypto industry (e.g., Helium) naturally have higher room for growth. Those whose TAM are limited to the crypto market are confined to the growth rate of their sector or loosely the total crypto market cap.
Valuation Logic: (TAM x Growth rate) x (Project’s Market share x Growth rate or Adoption)
3. Net Present Value of Price
Applicable Projects: All protocols.
Net Present Value of Price is a derivative of Discounted Cash Flow (DCF) valuation of an asset based on expectations for future utility. DCF is an equity valuation method used to estimate the value of an investment based on its expected future cash flows. Due to the lack of clear cash flow in most crypto projects, DCF is modified to NPVP.
Calculation:
NPVP = EFP/(1-r)^Y
NPVP: Net Present Value of Price or Discounted Price
EFP: Expected Future Price
r: Discount rate
Y: Number of discounted Years
A conservative approach often assumes a 30–50% discount rate. This is 3–5 times the discount rate of high-risk assets (Equities with high WACC) in the equity market.
If you decrease your discount rate (r) because you deem the asset less risky and thus need to be compensated less, you are okay buying the asset for a slightly higher price.
Significance: The discount price shows what you expect to be compensated for holding a risky asset over time. Considering the market price assets based on future expectations, a future utility value must be discounted back to the present to arrive at a reasonable market price for any given year.
Valuation Logic (MC): A NPVP value higher than the current asset price suggests undervaluation and vice versa.
Data Resources:
EFP: This is a secondary analysis based on the other metric.
4. Equation of Exchange
The Equation of Exchange addresses the relationship between the money supply, real GDP, price level, and velocity of money. It essentially measures the amount of money needed to sustain an economy. The equation shows that total spending (M x V) equals total sales revenue (P x Q). Total spending is the money supply times the velocity of money, and total sales revenue is the price level times real GDP.
Calculation: MV = PQ
M: the size of the asset base (Market Cap) A crypto asset valuation is mainly solving for M, i.e., the market cap. M is the size of the monetary base required to sustain a PQ-sized crypto economy flowing at V velocity.
M = PQ / V.
P = price of the resource being provisioned
Contrary to common misconception, P doesn’t represent the token’s price but the price of the service offered by the protocol. For instance, for a protocol like Arweave is the price per gigabyte of storage.
Q = quantity of the resource being provisioned.
Again, using Arweave as an example. Q represents the amount of GB space being served.
So total sales revenue: P($/GB) x Q(GB) = $.
The dollar amount represents the GDP of the Arweave economy, which is the amount of resources required by Arweave to provide its services.
V = velocity of the asset;
Velocity is the average number of times a currency unit is spent on final goods and services in a particular period. That is, it measures how fast the currency is changing hands. Velocity is solved by rearranging the equation to V = PQ/M and applied to a past year, referred to as the base year.
For example, assuming Bitcoin’s total on-chain transaction value(PQ) for 2021 is $4 trillion. With an average asset base (market cap) of $1 trillion, V equals 4 ($4T / $1T). This means that each BTC changed hands four times on average. However, in reality, a much smaller portion of BTC supply probably changed hands much more frequently, while a much bigger portion remained in possession of hodlers.
Significance: The equation of exchange is used to understand the flow of money needed to support an economy, making it a cornerstone to crypto asset valuations.
Valuation Logic (MC): Extrapolate velocity V from a base year (PQ = Annual transaction volume; M = Market Cap). Factor in the growth rate of PQ and the network expected value in the given period. And insert the variables in the formula M = PQ / V.
For example, to determine the variables for solving for M in Arweave 2022 valuation.
Estimate the protocol’s PQ based on its transaction volume.
Extrapolate its V from the previous year.
For networks with no base year,i.e., new protocols, I will use a comparable project’s velocity from a similar growth stage.
Note: For reasons below, velocity (V) can be a bit of a fudge factor, which puts this model in question. But needless to say, it is an exciting model to consider.
For a more accurate representation of a network’s GDP, the speculative portion of its transaction value must be factored out. A considerable chunk (about 30%+) of the transaction value of a crypto asset is often transactions between exchanges. Because these transactions do not add to the demand for the network’s service, they inflate the transaction value of the network.
Also, secondary networks like layer 2 solutions reduce the transaction value of their primary network, thus making their GDP assessment conservative. However, the tokens on these secondary networks can be excluded from the circulating tokens (Q) in GDP (P x Q) calculation.
5. Fully Diluted Value to Market Capitalization Ratio (FDV/MC)
Applicable Projects: All protocols.
A fully diluted value is a protocol’s total value (market cap) at today’s price if all its tokens are in circulation. Fully diluted value-to-market cap ratio measures the multiple of Market cap growth required to sustain a token price at maximum supply. If a token, $ABC, has an FDV/MC ratio of 5 and a price of $10, the market cap of $ABC has to multiply by five to sustain the price of $10 by the time all $ABC tokens are in circulation.
I have seen many investors attempt to use FDV to assess the viability of a crypto investment, but often in error. At least, I think so.
They mostly just look at the size of the FDV/MC ratio to assess an impending supply price impact. Another approach they take is comparing this ratio for several assets to derive a relative valuation — although less simplistic, it is still inefficient.
FDV makes little sense in isolation. The full breadth of supply must be considered to effectively utilize FDV in a valuation model. This includes the context of time. Unlike the equity market, where shares are static, crypto token supply is dynamic. To accurately determine a token’s future supply, you must consider the vesting schedule, unlock period, and bonding rate. Failing to explore the full extent of supply results in the underutilization of the FDV/MC ratio.
Here’s an example breaking down my point.
Say we have two tokens, $ABC and $XYZ, with FDV/MC ratios of 5 and 2, respectively. How do we determine which option is a better investment using FDV/MC ratio? First, we analyze the question.
Translation:
The $ABC market cap will have to grow 5X to sustain its current price by the time all its tokens are in circulation. Similarly, the $XYZ market cap will have to increase 2X to sustain its current price by the time all its tokens are in circulation.
Key phrases:
By the time: On first observation, $XYZ seems like a better investment because it will take fewer resources to accommodate its maximum supply without price tanking. However, you must consider these tokens’ time to reach their maximum supply.
Here’s another question for you:
What if $ABC has one year to reach its maximum supply, and $XYZ, five years? Can you objectively say $ABC is a better opportunity based on their FDV/MC ratio? Well, No. For two reasons:
Firstly, You might not be invested in the project for that long. This means you won’t have to bear the full brunt of that supply pressure. Secondly, You have to consider the growth potential of the assets to know if the supply pressure will be negligible in the future.
In Circulation: As aforementioned, token supply is dynamic. So to accurately project future circulating supply, you have to consider factors like staking, burning, bonding, and other forms of float reduction.
The asset’s growth potential is another critical factor to consider in using FDV as a valuation metric. This is something I’ll be covering at length in the next part of this series. I will show you how to use adjusted circulating supply and growth potential as a secondary model for predicting a token’s future price.
CONCLUSION
Asset valuation is both an art and a science and encourages your creativity as an analyst. Every financial model has subjective factors that create room for your unique perspective. Rather than inheriting someone else’s investment thesis and ideologies, concepts like these help you come up with your own.
I encourage you to build frameworks and financial models out of these metrics. If you are unsure how to go about it, don’t worry, I got you. My future posts will include crypto deep dive research reports that cover every critical aspect of exciting protocols. So subscribe to stay in the know.
CREDITS
Much gratitude goes to the following name whose works I have heavily drawn from to put together this guide. And friends who have helped review and refine this work.
Crypto research @CryptoManagers
Corporate Finance Institute @CFI_education
Thanks for reading Kris RenZo’s Newsletter! Subscribe for free to receive new posts and support my work.
Hello ser, did you delete the rest of the article? Was looking forward to reading this :/